A comprehensive new survey of over 22,000 Americans has painted a complex and often contradictory picture of LGBTQ+ rights in the United States, revealing a nation deeply divided by geography, politics, and religious ideology.
The 2025 American Values Atlas, conducted by the Public Religion Research Institute (PRRI), confirms that majorities of Americans continue to support key protections for the LGBTQ+ community. However, the data also highlights a recent softening of that support and exposes the starkly different realities for queer individuals depending on which state they call home.
The National Picture: A Decade of Shifting Tides
Across the U.S., support for fundamental LGBTQ+ rights remains solid, though it has receded slightly from recent peaks. The report tracks three key policy areas:
- Nondiscrimination Protections: 72% of Americans support laws protecting LGBTQ+ people from discrimination in employment, housing, and public accommodations. This is a strong majority, but it marks a decline from a high of 80% in 2022.
- Same-Sex Marriage: Support for marriage equality stands at 65%, a significant increase from 53% in 2015. However, this figure has also dipped slightly from 69% in 2022.
- Religiously-Based Service Refusals: A consistent majority (59%) oppose allowing small businesses to refuse service to LGBTQ+ people on religious grounds. This number has remained relatively stable over the past decade.
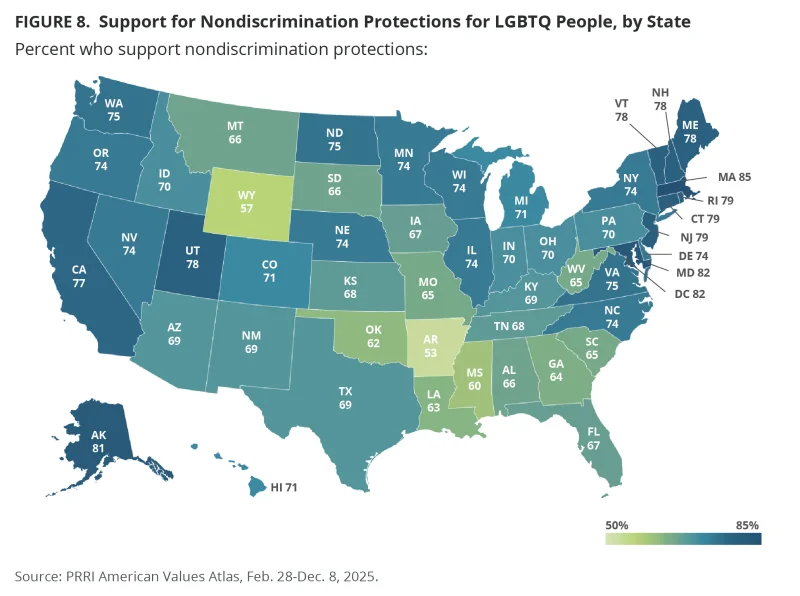
A Map of Division: Rights Vary by State
The survey data starkly illustrates that LGBTQ+ equality in America is far from uniform. A person's rights and the public's acceptance can change dramatically simply by crossing a state line. The contrast is most visible between progressive coastal states and more conservative states in the South and Mountain West.
States with the highest levels of support include:
- Massachusetts: 85% support for nondiscrimination protections and 85% for same-sex marriage.
- Vermont: 81% support for same-sex marriage and 71% opposition to service refusals.
- Rhode Island: 85% support for same-sex marriage.
In contrast, states with the lowest levels of support are:
- Mississippi: Only 47% support same-sex marriage, making it the only state without a majority in favour. Support for nondiscrimination is 60%.
- Arkansas: Same-sex marriage support is at a slim 50%, while support for nondiscrimination laws is the lowest in the nation at 53%.
- Wyoming: Shows the second-lowest support for nondiscrimination at 57%.
The Political and Religious Fault Lines
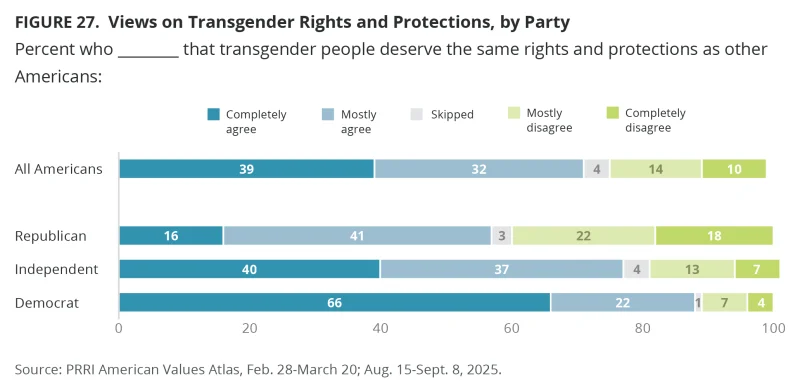
The survey identifies political affiliation and adherence to Christian nationalist ideology as the strongest predictors of attitudes towards LGBTQ+ rights. The gap between the two main political parties is substantial. For example, 83% of Democrats support same-sex marriage, compared to just 49% of Republicans.
The report also highlights the influence of Christian nationalism—a political ideology asserting the U.S. is a Christian nation and its laws should be based on Christian values. This ideology, which is distinct from personal religious faith, is strongly correlated with opposition to LGBTQ+ equality. Nearly all (93%) of those who reject Christian nationalism support same-sex marriage, while only 22% of its strongest adherents do.
The Paradox of Transgender Rights
Perhaps one of the most telling findings concerns attitudes toward the transgender community. The data reveals a significant public contradiction:
- A large majority of Americans (71%) agree that "transgender people deserve the same rights and protections as other Americans."
- Simultaneously, a majority (56%) also favour laws requiring transgender individuals to use bathrooms that correspond to their sex assigned at birth.
This suggests that while Americans support transgender rights in principle, that support becomes more tenuous when faced with specific, often politicised, scenarios. Notably, support for these restrictive bathroom laws has increased significantly from 35% in 2016.
A Profile of LGBTQ+ America
The survey also provides a demographic snapshot, finding that one in ten Americans (10%) identify as LGBTQ+. This figure rises to one in five (20%) among young adults aged 18-29, indicating a significant generational shift. Demographically, LGBTQ+ Americans are more likely to be politically liberal, identify as Democrats, and be religiously unaffiliated compared to the general population.